Multiple Choice
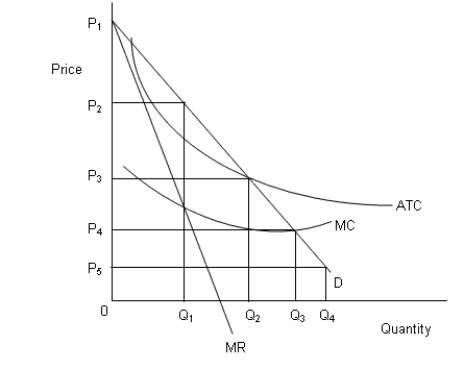
The figure below shows revenue and cost curves of a natural monopoly firm.Figure 14.1
 In the figure,
D: Demand curve
MR: Marginal revenue curve
MC: Marginal cost curve
ATC: Average total cost curve
-Which of the following calculations is necessary to determine whether a regulation should be implemented?
A) Marginal cost-marginal revenue calculations
B) Cost effectiveness calculations
C) Total cost-total revenue calculations
D) Cost minimization calculations
E) Cost-benefit calculations
Correct Answer:

Verified
Correct Answer:
Verified
Q55: The figure below shows revenue and cost
Q56: <img src="https://d2lvgg3v3hfg70.cloudfront.net/TB1748/.jpg" alt=" -A monopolistic industry
Q57: The figure below shows revenue and cost
Q58: The figure below shows revenue and cost
Q59: <img src="https://d2lvgg3v3hfg70.cloudfront.net/TB1748/.jpg" alt=" -Which of the
Q61: In the following figure, the first panel
Q62: In the following figure, the first panel
Q63: In the following figure, the first panel
Q64: In the following figure, the first panel
Q65: In the following figure, the first panel