Multiple Choice
In the following figure,the first panel shows a market situation prior to regulation and the second panel shows the effects of regulation. Figure 12.2 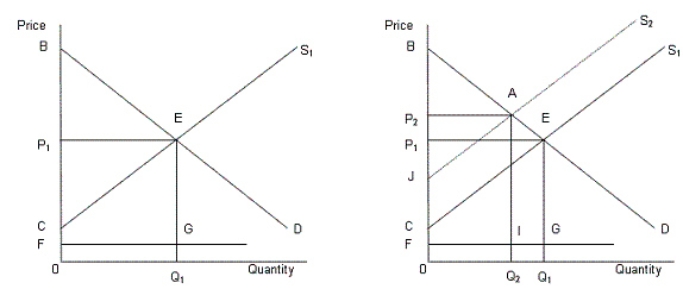 In the figure,
D: Demand curve for automobiles
S1: Supply curve of automobiles prior to regulation
S2: Supply curve of automobiles after regulation
FG: Clean up cost per unit
-According to Figure 12.2,the total clean up cost after the regulation is:
A) area 0FIQ2.
B) area 0FGQ1.
C) area BEC.
D) area BEP1.
E) area BEGF.
Correct Answer:

Verified
Correct Answer:
Verified
Q7: In the following figure, the first panel
Q11: In the following figure, the first panel
Q35: In the following figure, the first panel
Q49: <img src="https://d2lvgg3v3hfg70.cloudfront.net/TB1748/.jpg" alt=" -A market is
Q50: <img src="https://d2lvgg3v3hfg70.cloudfront.net/TB1748/.jpg" alt=" -Under George W.
Q59: The figure below shows revenue and cost
Q63: Bills introduced in the United States in
Q65: Which of the following does the Sherman
Q66: In the following figure,the first panel shows
Q77: In the following figure, the first panel