Multiple Choice
The figure below shows revenue and cost curves of a natural monopoly firm. Figure 12.1 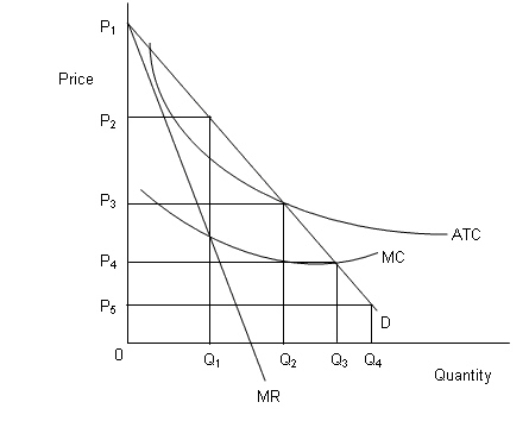 In the figure,
D: Demand curve
MR: Marginal revenue curve
MC: Marginal cost curve
ATC: Average total cost curve
-Refer to Figure 12.1.Identify the fair-rate-of-return price.
A) P5
B) P2
C) P4
D) P1
E) P3
Correct Answer:

Verified
Correct Answer:
Verified
Q3: The figure below shows revenue and cost
Q7: In the following figure, the first panel
Q11: In the following figure, the first panel
Q35: In the following figure, the first panel
Q49: <img src="https://d2lvgg3v3hfg70.cloudfront.net/TB1748/.jpg" alt=" -A market is
Q50: <img src="https://d2lvgg3v3hfg70.cloudfront.net/TB1748/.jpg" alt=" -Under George W.
Q54: If the tax rate increases with an
Q61: In the following figure,the first panel shows
Q63: Bills introduced in the United States in
Q77: In the following figure, the first panel