Multiple Choice
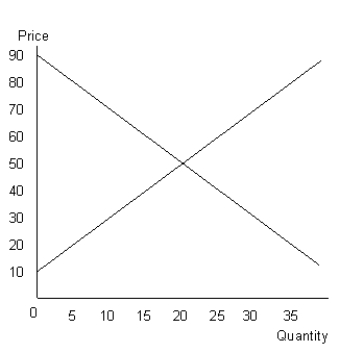
The figure given below shows the aggregate demand and supply curves of a perfectly competitive market.Figure 10.7

-Which of the following will be the best example of a monopoly firm?
A) The US Bank
B) The Bank of America
C) National City Bank
D) The Federal Reserve
E) Washington Mutual Funds Bank
Correct Answer:

Verified
Correct Answer:
Verified
Q20: The figures given below represent the revenue
Q21: The figure given below shows the cost
Q22: The figure given below shows the cost
Q23: The figure given below shows the aggregate
Q24: The table given below shows the price
Q26: The following table shows the marginal revenues
Q27: The table given below shows the price,
Q28: The figure given below shows the cost
Q29: The figure given below shows the aggregate
Q30: The table given below shows the price,