Multiple Choice
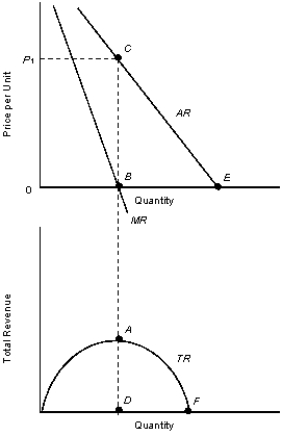
The figures given below represent the revenue curves of a monopolist.Figure 11.2
 TR: Total revenue curve
AR: Average revenue curve
MR: Marginal revenue curve
-Refer to Figure 11.2. If the output at E is 600 units, then the output at B is _____ units. (We know that the slope of the marginal revenue curve is twice the slope of the average revenue curve.)
A) 900 units.
B) 200 units.
C) 300 units.
D) 1200 units.
E) 800 units.
Correct Answer:

Verified
Correct Answer:
Verified
Q15: The figure given below shows the cost
Q16: The following figures show the demand and
Q17: The figures given below represent the revenue
Q18: The following figures show the demand and
Q19: The figures given below represent the revenue
Q21: The figure given below shows the cost
Q22: The figure given below shows the cost
Q23: The figure given below shows the aggregate
Q24: The table given below shows the price
Q25: The figure given below shows the aggregate