Multiple Choice
The figure given below shows the demand curve faced by a firm. Figure 10.1 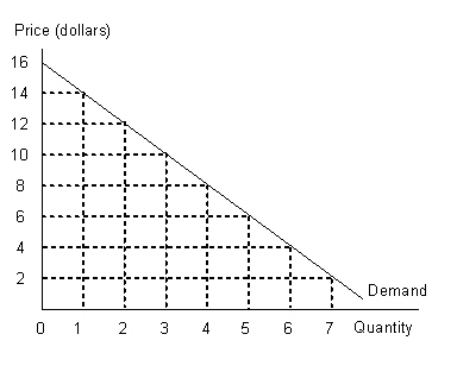 Refer to Figure 10.1 and calculate the revenue gained by the firm when it reduces the price of its product from $8 to $4.
A) $4
B) $8
C) $32
D) $16
E) $10
Correct Answer:

Verified
Correct Answer:
Verified
Related Questions
Q11: The figure given below shows the cost
Q62: The ability of a firm to charge
Q64: The following figures show the demand and
Q65: The following table shows the units of
Q66: In many cities the market for cab
Q68: The following table shows the marginal revenues
Q71: The following figures show the demand and
Q72: For a monopolist with a linear demand
Q95: The figure given below shows the cost
Q117: The figure given below shows the cost