Multiple Choice
The following figures show the demand and cost curves of a perfectly competitive and a monopoly firm respectively. Figure 10.7 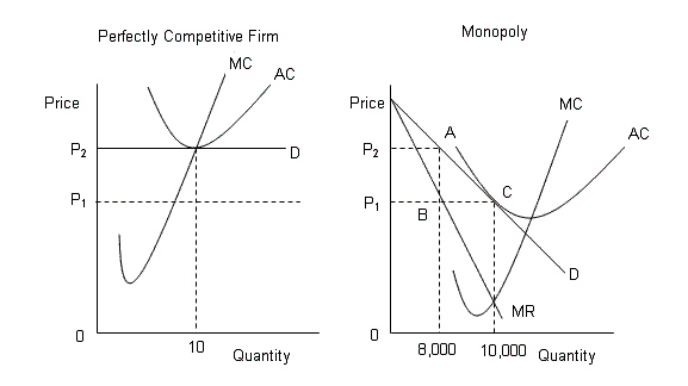
D: Average Revenue
AC: Average cost
MC: Marginal cost
MR: Marginal cost
-According to Figure 10.7,when the monopolist is maximizing profit:
A) its resources are not being used efficiently.
B) its price is higher than that charged by the perfectly competitive firm.
C) its price is equal to the price charged by the perfectly competitive firm.
D) it is earning above-normal profit.
E) it is actually incurring a loss.
Correct Answer:

Verified
Correct Answer:
Verified
Q7: The figure given below shows the cost
Q11: The figure given below shows the cost
Q66: In many cities the market for cab
Q67: The figure given below shows the demand
Q68: The following table shows the marginal revenues
Q72: For a monopolist with a linear demand
Q73: Perfect competition provides one model in which
Q76: The table given below shows the price,marginal
Q95: The figure given below shows the cost
Q105: The figure given below shows the aggregate