Multiple Choice
The following figure shows the revenue and cost curves of a monopolist. Figure 10.3 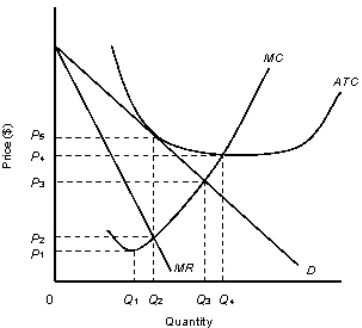 D: Average Revenue
MR: Marginal Revenue
ATC: Average Total Cost
MC: marginal Cost
-Consider the monopolist described in the Figure 10.3.If the firm engages in profit-maximizing behavior,economic profit per unit of output will be:
A) 0
B) P2
C) P4 minus P2
D) P5 minus P4
E) P5 minus P1
Correct Answer:

Verified
Correct Answer:
Verified
Q8: The table given below shows the prices
Q11: Which of the following is not a
Q16: The following figure shows the revenue curves
Q17: A firm such as a public utility,which
Q21: The figure given below shows the cost
Q22: The figure given below shows the cost
Q59: The table given below shows the price,
Q62: The figure given below shows the cost
Q69: The table given below shows the price,
Q111: The table given below shows the prices