Multiple Choice
The following figure shows the revenue curves of a monopolist: Figure 10.6 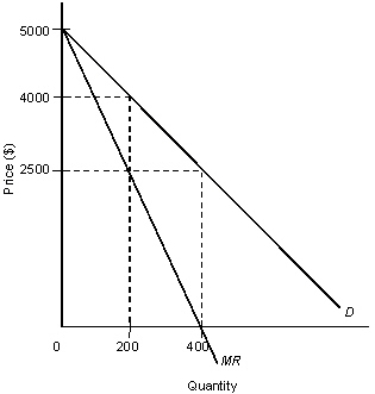
D: Average revenue
MR: Marginal revenue
-In Figure 10.6,assume that marginal costs are constant at $2,500 and fixed costs are 0.What would be the amount of consumer surplus if the market was perfectly competitive?
A) $1,000,000
B) $500,000
C) $300,000
D) $250,000
Correct Answer:

Verified
Correct Answer:
Verified
Q11: Which of the following is not a
Q13: The following figure shows the revenue and
Q17: A firm such as a public utility,which
Q19: The following table shows the units of
Q20: The figures given below represent the revenue
Q59: The table given below shows the price,
Q62: The figure given below shows the cost
Q69: The table given below shows the price,
Q110: The table given below shows the price,
Q111: The table given below shows the prices