Multiple Choice
The figure below shows the market equilibrium (point B) at the intersection of demand and supply curves under perfect competition. Figure 10.5 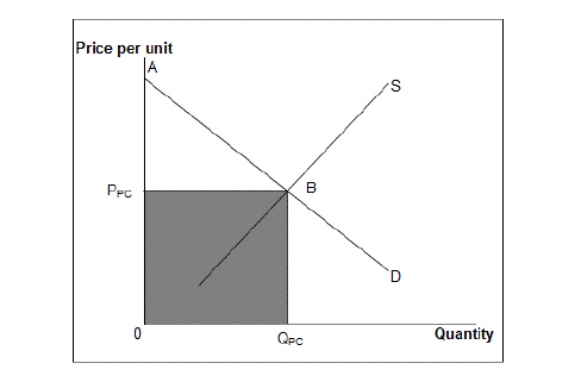
D: Market demand curve
S: Market supply curve
-Refer to Figure 10.5.Which of the following regions on the graph represents consumer surplus in a perfectly competitive market?
A) The area PPCBA
B) The area 0BPPC
C) The area 0BA
D) Half of area PPCBA
E) The area ABS
Correct Answer:

Verified
Correct Answer:
Verified
Q8: The figure given below shows the demand
Q22: A local monopoly is a firm that:<br>A)is
Q23: The figure given below shows the cost
Q24: Perfect price discrimination occurs when:<br>A)each customer is
Q28: The figure below shows the market equilibrium
Q32: The table given below shows the price,marginal
Q35: The figure given below shows the cost
Q46: The figure given below shows the aggregate
Q68: The figure given below shows the cost
Q101: The figure given below shows the aggregate