Multiple Choice
The figure given below shows the cost and revenue curves of a monopolist. Figure 10.9 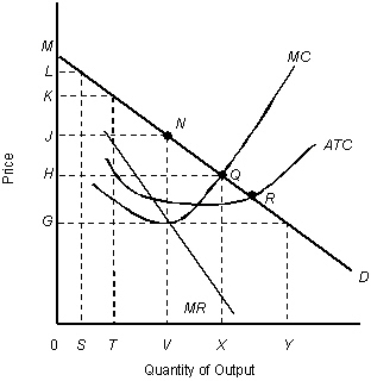 D: Average revenue
MR: Marginal revenue
ATC: Average total cost
MC: Marginal cost
-Refer to Figure 10.9.Suppose that the market is perfectly competitive.The consumer surplus would be represented by the area _____.
A) JNM
B) 0JNV
C) HMQ
D) 0HQX
E) JHQN
Correct Answer:

Verified
Correct Answer:
Verified
Q19: The following table shows the units of
Q20: The figures given below represent the revenue
Q22: A local monopoly is a firm that:<br>A)is
Q24: Perfect price discrimination occurs when:<br>A)each customer is
Q27: The figure below shows the market equilibrium
Q28: The figure below shows the market equilibrium
Q68: The figure given below shows the cost
Q101: The figure given below shows the aggregate
Q110: The table given below shows the price,
Q111: The table given below shows the prices