Multiple Choice
The following figure shows revenue and cost curves of a monopolist. Figure 10.8 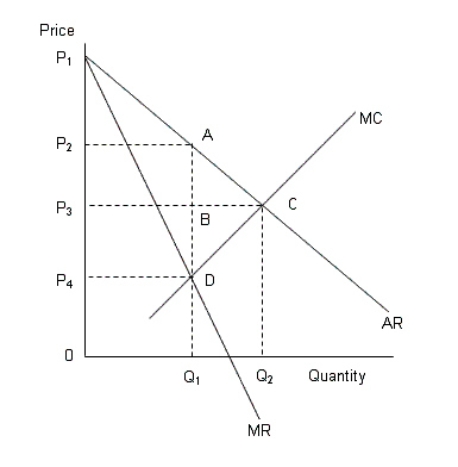 AR: Average revenue curve
MR: Marginal revenue curve
MC: Marginal cost curve
-According to Figure 10.8,the deadweight loss of monopoly is:
A) the area ABC.
B) the area BCD.
C) the area ACD.
D) the area P3P2AC.
E) the area P3P4DC.
Correct Answer:

Verified
Correct Answer:
Verified
Q43: The figure given below shows the cost
Q48: The figure given below shows the cost
Q76: The figure given below shows the cost
Q86: The figure given below shows the demand
Q87: Firms that have downward-sloping demand curves:<br>A)earn positive
Q88: The table given below shows the price
Q89: Barriers to entry do not occur when:<br>A)economies
Q90: The figure given below shows the cost
Q95: The following figure shows revenue and cost
Q113: The figure given below shows the cost