Multiple Choice
The figure given below shows the cost and revenue curves of a monopolist. Figure 10.9 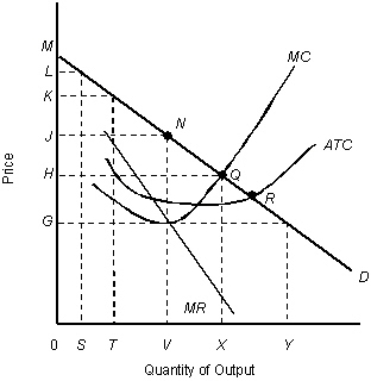
D: Average revenue
MR: Marginal revenue
ATC: Average total cost
MC: Marginal cost
-In Figure 10.9,what is the consumer surplus at the profit-maximizing levels of output and price?
A) JNM
B) 0JNV
C) HMQ
D) 0HQX
E) JHQN
Correct Answer:

Verified
Correct Answer:
Verified
Q43: The figure given below shows the cost
Q57: The table given below shows the price,
Q76: The figure given below shows the cost
Q86: The figure given below shows the demand
Q87: Firms that have downward-sloping demand curves:<br>A)earn positive
Q88: The table given below shows the price
Q89: Barriers to entry do not occur when:<br>A)economies
Q91: The following figure shows revenue and cost
Q95: The following figure shows revenue and cost
Q113: The figure given below shows the cost