Multiple Choice
The below indifference map shows the various combinations of hours of music and apples that yield different levels of utility. Figure 6.1 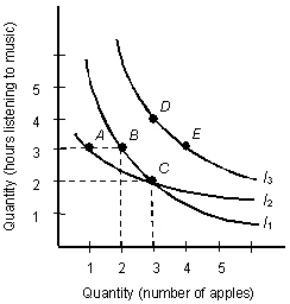
- Which of the following explains why indifference curve I2 should not cross indifference curve I1 as shown in Figure 6.1?
A) The consumer is not indifferent between A and B.
B) The consumer is not indifferent between A and C.
C) The consumer is not indifferent between B and C.
D) The consumer is not indifferent between D and E.
E) There is no reason why indifference curve I2 should not cross indifference curve I1 as shown.
Correct Answer:

Verified
Correct Answer:
Verified
Q66: The below figure shows the various combinations
Q120: The table given below reports the total
Q121: The below table shows the average utility
Q123: The below figure shows the various combinations
Q126: Jen spent her weekly allowance of $110
Q129: In labor markets,a change in the wage
Q134: The table below shows the total utility
Q141: The table below shows the total utility
Q142: The below figure shows the various combinations
Q195: Marginal utility is total utility divided by