True/False
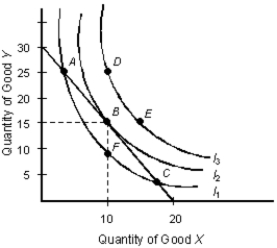
The below figure shows the various combinations of the goods X and Y that yield different levels of utility.Figure 7.3

-If all consumers had identical preferences, then their marginal utility schedules would be the same.
Correct Answer:

Verified
Correct Answer:
Verified
Related Questions
Q132: The table below shows the total utility
Q133: The below figure shows the various combinations
Q134: The table below shows the total utility
Q135: The below table shows the average utility
Q136: The below figure shows the various combinations
Q137: Scenario 5.1<br>The demand for noodles is given
Q138: The table below shows the total utility
Q139: The below figure shows the various combinations
Q140: Scenario 5.1<br>The demand for noodles is given
Q141: The table below shows the total utility