Multiple Choice
The figure given below represents two indifference curves I1 and I2 of an individual. Figure 6.2 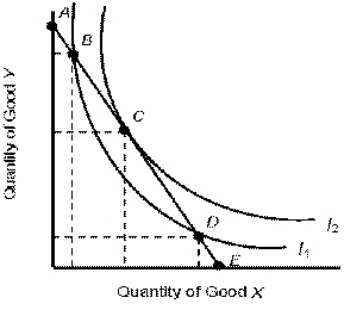
- Refer to Figure 6.2.Which of the following statements is true?
A) Point B yields a greater level of satisfaction than point D.
B) Points A and E yield the same level of satisfaction.
C) Point B yields a greater level of satisfaction than point C.
D) I2 represents a greater level of satisfaction than I1.
E) Point C yields a lower level of satisfaction than point D.
Correct Answer:

Verified
Correct Answer:
Verified
Q8: The table below shows the total utility
Q26: The table below shows the total utility
Q28: The below figure shows the various combinations
Q31: The below figure shows the various combinations
Q32: _ is the lack of satisfaction yielded
Q33: The prices that people are willing to
Q40: The below table shows the average utility
Q80: Scenario 5.1<br>The demand for noodles is given
Q98: Scenario 5.1<br>The demand for noodles is given
Q139: The below figure shows the various combinations