Multiple Choice
The below figure shows the various combinations of the goods X and Y that yield different levels of utility. Figure 6.3 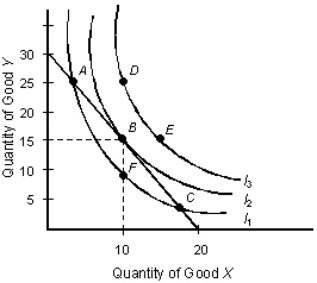
-In Figure 6.3,the consumer is in equilibrium at point:
A) A
B) B
C) C
D) D
E) E
Correct Answer:

Verified
Correct Answer:
Verified
Related Questions
Q8: The table below shows the total utility
Q23: Suppose two out for coffee and donuts
Q26: The table below shows the total utility
Q29: The figure given below represents two indifference
Q31: The below figure shows the various combinations
Q32: _ is the lack of satisfaction yielded
Q33: The prices that people are willing to
Q40: The below table shows the average utility
Q80: Scenario 5.1<br>The demand for noodles is given
Q139: The below figure shows the various combinations