Multiple Choice
The figure given below represents two indifference curves I1 and I2 of an individual. Figure 6.2 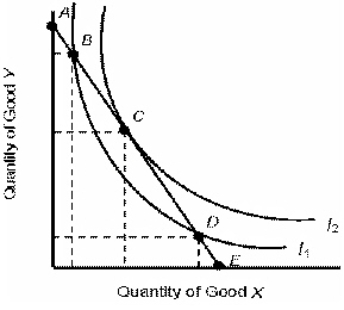
- Refer to Figure 6.2.At which point in the figure above will the consumer maximize satisfaction?
A) A
B) B
C) C
D) D
E) E
Correct Answer:

Verified
Correct Answer:
Verified
Related Questions
Q13: The below table shows the average utility
Q21: The below table shows the average utility
Q28: The below table shows the average utility
Q32: The below table shows the average utility
Q56: The below indifference map shows the various
Q97: When the price of a good changes,the
Q98: The table given below depicts the total
Q102: The table below shows the total utility
Q105: Buyers who are persuaded to take a
Q110: The below figure shows the various combinations