Multiple Choice
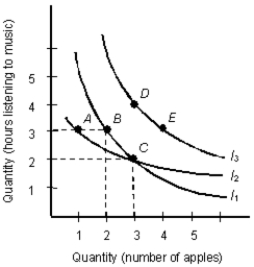
The below indifference map shows the various combinations of hours of music and apples that yield different levels of utility.Figure 7.1
-The different combinations of any two goods that an individual can afford to purchase, given his income and prices, is shown by:
A) an indifference curve.
B) an indifference map.
C) a budget line.
D) a demand curve.
E) a supply curve.
Correct Answer:

Verified
Correct Answer:
Verified
Q51: The below figure shows the various combinations
Q52: The table given below reports the total
Q53: The below table shows the average utility
Q54: The table given below depicts the total
Q55: The below figure shows the various combinations
Q57: The table below shows the total utility
Q58: The table given below depicts the total
Q59: The below indifference map shows the various
Q60: The below table shows the average utility
Q61: The table below shows the total utility