Multiple Choice
The figure given below shows the demand curves for five products: A,B,C,D,andE. Figure 5.1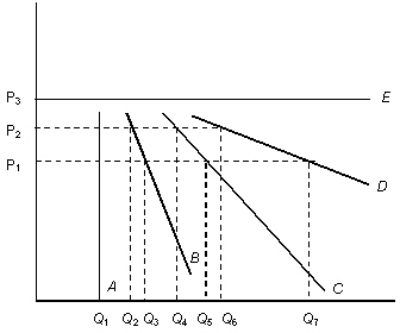
- In Figure 5-1,which demand curve is most likely to represent demand for insulin by diabetics?
A) A
B) B
C) C
D) D
E) E
Correct Answer:

Verified
Correct Answer:
Verified
Related Questions
Q3: Cross-price elasticity is represented by the formula
Q5: Scenario 5.1<br>The demand for noodles is given
Q5: A horizontal demand curve shows that demand
Q8: Suppose 50 loaves of bread are demanded
Q10: The table below shows the quantities of
Q11: If demand is unit-elastic,a 25 percent increase
Q15: Scenario 5.1<br>The demand for noodles is given
Q49: Scenario 5.1<br>The demand for noodles is given
Q52: The figure given below shows the demand
Q79: Scenario 5.1<br>The demand for noodles is given