Multiple Choice
The figure below represents the results of a DNA microarray experiment that compared a cell line before and after treatment with drug. What would be an appropriate conclusion to draw from this data? 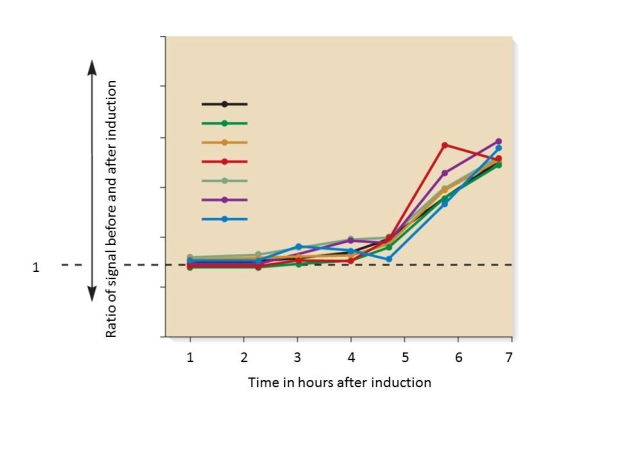
A) At one hour post induction none of the mRNAs that are in the figure are producing protein
B) Some of the genes that are presented may have significant amounts of mRNA in the cell prior to induction.
C) The amount of protein for each gene presented will show a similar increase as the mRNA.
D) At seven hours post-induction the treated cells should have the maximal amount of mRNA for each gene.
Correct Answer:

Verified
Correct Answer:
Verified
Q2: What is the term for two genes
Q9: _ make it possible for researchers to
Q10: What does detection of a fluorescent signal
Q13: A database is defined as<br>A) A large
Q14: The program BLAST would be best used
Q15: DNA microarrays may be paired with chromatin
Q24: The purpose of sodium dodecyl sulfate (SDS)
Q25: A pattern recognition algorithm examines a string
Q27: What technique can be used to identify
Q32: What type of molecule is used in