Multiple Choice
Figure 7-3
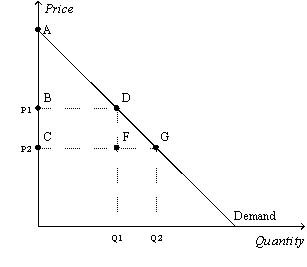
-Refer to Figure 7-3.When the price falls from P1 to P2,which area represents the increase in consumer surplus to existing buyers?
A) ABD
B) ACG
C) BCFD
D) DFG
Correct Answer:

Verified
Correct Answer:
Verified
Q9: The 2005 Boston Globe article discussing ticket
Q33: Table 7-4<br>The numbers in Table 7-1 reveal
Q57: When a buyer's willingness to pay for
Q68: Inefficiency exists in an economy when a
Q85: Moving production from a high-cost producer to
Q110: Table 7-11<br><br><br> <span class="ql-formula" data-value="\begin{array}
Q133: If the price a consumer pays for
Q170: Table 7-8<br><br><br> <span class="ql-formula" data-value="\begin{array}
Q416: Figure 7-12<br> <img src="https://d2lvgg3v3hfg70.cloudfront.net/TB2185/.jpg" alt="Figure 7-12
Q418: Figure 7-18<br> <img src="https://d2lvgg3v3hfg70.cloudfront.net/TB2185/.jpg" alt="Figure 7-18