Multiple Choice
Figure 17-2. On the graph, MS represents the money supply and MD represents money demand. The usual quantities are measured along the axes. 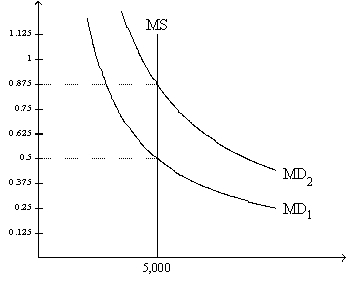
-Refer to Figure 17-2. If the relevant money-demand curve is the one labeled MD1, then
A) when the money market is in equilibrium, one dollar purchases one-half of a basket of goods and services.
B) when the money market is in equilibrium, one unit of goods and services sells for 2 dollars.
C) there is an excess demand for money if the value of money in terms of goods and services is 0.375.
D) All of the above are correct.
Correct Answer:

Verified
Correct Answer:
Verified
Q25: During the last tax year you lent
Q65: The nominal interest rate is 4%,the inflation
Q79: Higher inflation<br>A)causes firms to change prices less
Q111: Relative-price variability<br>A)rises with inflation, leading to an
Q111: According to the classical dichotomy,which of the
Q130: If the quantity of money supplied is
Q193: According to the classical dichotomy,when the money
Q287: Figure 17-3. On the graph, MS represents
Q293: Given a nominal interest rate of 8
Q296: Define each of the symbols and explain