Multiple Choice
Figure 17-3. On the graph, MS represents the money supply and MD represents money demand. The usual quantities are measured along the axes. 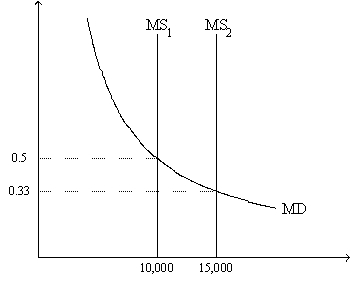
-Refer to Figure 17-3. If the relevant money-supply curve is the one labeled MS1, then the equilibrium price level is
A) 0.5 and the equilibrium value of money is 2.
B) 2 and the equilibrium value of money is 0.5.
C) 0.5 and the equilibrium value of money cannot be determined from the graph.
D) 2 and the equilibrium value of money cannot be determined from the graph.
Correct Answer:

Verified
Correct Answer:
Verified
Q36: U.S.tax laws allow taxpayers,in computing the amount
Q65: The nominal interest rate is 4%,the inflation
Q111: According to the classical dichotomy,which of the
Q111: Relative-price variability<br>A)rises with inflation, leading to an
Q130: If the quantity of money supplied is
Q177: If the Fed increases the money supply,
Q193: According to the classical dichotomy,when the money
Q237: Over time both real GDP and the
Q283: Figure 17-3. On the graph, MS represents
Q291: Figure 17-2. On the graph, MS represents