Multiple Choice
Figure 17-3. On the graph, MS represents the money supply and MD represents money demand. The usual quantities are measured along the axes. 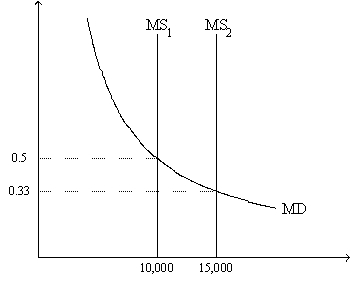
-Refer to Figure 17-3. At the end of 2009 the relevant money-supply curve was the one labeled MS1. At the end of 2010 the relevant money-supply curve was the one labeled MS2. Assuming the economy is always in equilibrium, what was the economy's approximate inflation rate for 2010?
A) -33 percent
B) 17 percent
C) 50 percent
D) 67 percent
Correct Answer:

Verified
Correct Answer:
Verified
Q7: In the fourteenth century,the Western African Emperor
Q36: U.S.tax laws allow taxpayers,in computing the amount
Q111: According to the classical dichotomy,which of the
Q177: If the Fed increases the money supply,
Q193: According to the classical dichotomy,when the money
Q229: Interest rates adjusted for the effects of
Q237: Over time both real GDP and the
Q279: You put money into an account that
Q280: If the nominal interest rate is 8
Q287: Figure 17-3. On the graph, MS represents