Multiple Choice
Figure 2.2 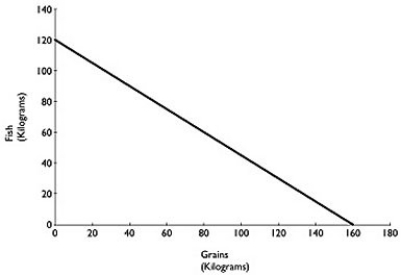 Figure 2.2 above shows the production possibilities frontier for Atikamekw Cree (ca.1600) with a historical tradition of fishing and farming.Assume they produce two goods: fish and grains.
Alt text for Figure 2.2: In figure 2.2, a graph compares production of grains and fish.
Long description for Figure 2.2: The x-axis is labelled, grains in kilograms, and the y-axis is labelled, fish in kilograms.The x-axis is marked from 0 to 180, in increments of 20.The y-axis is marked from 0 to 140, in increments of 20.A line slopes down from the point 0, 120 to the point 160, 0.
-Refer to Figure 2.2.What is the opportunity cost of one kilogram of grain?
A)  kilograms of fish
B) 1) 2 kilograms of fish
C)  kilograms of fish
D) 12 kilograms of fish
Correct Answer:

Verified
Correct Answer:
Verified
Q27: Table 2-1<br>Production choices for Tomaso's Trattoria<br> <img
Q30: Table 2.6 <img src="https://d2lvgg3v3hfg70.cloudfront.net/TB3061/.jpg" alt="Table 2.6
Q32: To compete in the automobile market, Toyota
Q35: Figure 2.6 <img src="https://d2lvgg3v3hfg70.cloudfront.net/TB3061/.jpg" alt="Figure 2.6
Q36: Figure 2.7 <img src="https://d2lvgg3v3hfg70.cloudfront.net/TB3061/.jpg" alt="Figure 2.7
Q38: Crystal Schick is a highly talented photographer.She
Q104: Suppose there is some unemployment in the
Q213: In a two-good,two country world,if one country
Q230: The payment received by suppliers of entrepreneurial
Q439: Figure 2-8 <img src="https://d2lvgg3v3hfg70.cloudfront.net/TB7397/.jpg" alt="Figure 2-8