Multiple Choice
Figure 2.7 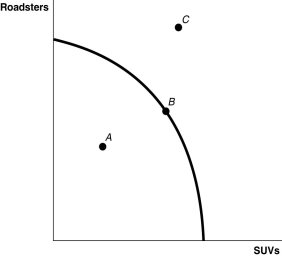 Alt text for Figure 2.7: In figure 2.7, a graph compares production possibility frontiers of S U Vs and Roadsters.
Long description for Figure 2.7: The x-axis is labelled, S U Vs, and the y-axis is labelled, Roadsters.A convex curve begins near the top of the y-axis and ends approximately 3 quarters of the way down the x-axis.The point B is plotted midway along the curve.Point A is plotted between the curve and the y-axis.Point C is plotted outside the curve, near the top of the y-axis and approximately midway along the x-axis.
-Refer to Figure 2.7. ________ is (are) technically efficient.
A) Point A
B) Point B
C) Point C
D) Points B and C
Correct Answer:

Verified
Correct Answer:
Verified
Q27: Table 2-1<br>Production choices for Tomaso's Trattoria<br> <img
Q32: To compete in the automobile market, Toyota
Q33: Figure 2.2 <img src="https://d2lvgg3v3hfg70.cloudfront.net/TB3061/.jpg" alt="Figure 2.2
Q35: Figure 2.6 <img src="https://d2lvgg3v3hfg70.cloudfront.net/TB3061/.jpg" alt="Figure 2.6
Q38: Crystal Schick is a highly talented photographer.She
Q40: Table 2.13 <img src="https://d2lvgg3v3hfg70.cloudfront.net/TB3061/.jpg" alt="Table 2.13
Q41: Figure 2.5 <img src="https://d2lvgg3v3hfg70.cloudfront.net/TB3061/.jpg" alt="Figure 2.5
Q104: Suppose there is some unemployment in the
Q108: _ a nation's production possibilities frontier represents
Q439: Figure 2-8 <img src="https://d2lvgg3v3hfg70.cloudfront.net/TB7397/.jpg" alt="Figure 2-8