Multiple Choice
Figure 2.2 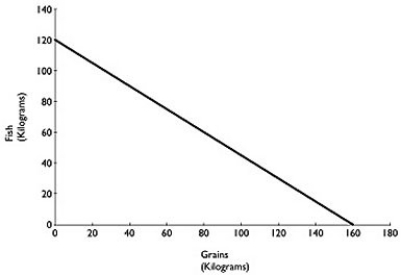 Figure 2.2 above shows the production possibilities frontier for Atikamekw Cree (ca.1600) with a historical tradition of fishing and farming.Assume they produce two goods: fish and grains.
Alt text for Figure 2.2: In figure 2.2, a graph compares production of grains and fish.
Long description for Figure 2.2: The x-axis is labelled, grains in kilograms, and the y-axis is labelled, fish in kilograms.The x-axis is marked from 0 to 180, in increments of 20.The y-axis is marked from 0 to 140, in increments of 20.A line slopes down from the point 0, 120 to the point 160, 0.
-Refer to Figure 2.2.The linear production possibilities frontier in the figure indicates that
A) Atikamekw Cree have a comparative advantage in the production of vegetables.
B) Atikamekw Cree have a comparative disadvantage in the production of meat.
C) the trade-off between producing fish and grain is constant.
D) it is progressively more expensive to produce fish.
Correct Answer:

Verified
Correct Answer:
Verified
Q49: Figure 2.9 <img src="https://d2lvgg3v3hfg70.cloudfront.net/TB3061/.jpg" alt="Figure 2.9
Q54: Figure 2.10 <img src="https://d2lvgg3v3hfg70.cloudfront.net/TB3061/.jpg" alt="Figure 2.10
Q55: Figure 2.6 <img src="https://d2lvgg3v3hfg70.cloudfront.net/TB3061/.jpg" alt="Figure 2.6
Q105: A decrease in the unemployment rate may
Q122: Table 2-1<br>Production choices for Tomaso's Trattoria<br> <img
Q127: What is comparative advantage? What is absolute
Q149: Adam Smith's invisible hand refers to<br>A)the government's
Q201: Published in 1776,_ was written by Adam
Q205: Adam Smith's _ refers to the process
Q212: List the four broad categories of factors