Multiple Choice
Figure 2.6 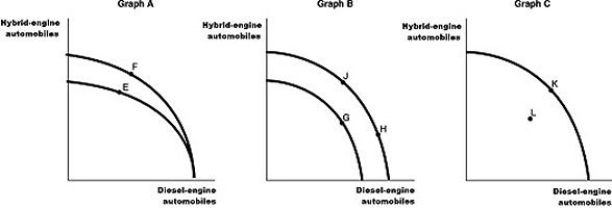 Toyota found the emission standards too difficult to meet to bring its diesel-engine offerings to North America.They have instead focused their research on hybrid-engine technology.Assume Toyota chooses to produce both hybrid-engine vehicles and diesel-engine vehicles (for markets outside North America) for its Prius brand.Figure 2.6 shows changes to its production possibilities frontier in response to new developments and different strategic production decisions.
Alt text for Figure 2.6: In figure 2.6, 3 graphs, A, B and C show the changes to Toyota's production possibilities frontier.
Long description for Figure 2.6: Graph A: The x-axis is labelled, diesel-engine automobiles, and the y-axis is labelled, hybrid-engine automobiles.2 convex curves are shown.The first curve begins slightly above the half-way point of the y-axis and ends near the end of the x-axis.The curve passes through point E about 1 third of the way along the curve.The second curve begins slightly above the first, on the y-axis.It finishes at the exact same point on the x-axis.The second curve passes through point F about 1 third of the way along the curve.Graph B: The x-axis is labelled, diesel-engine automobiles, and the y-axis is labelled hybrid-engine automobiles.2 convex curves are shown.The first curve begins slightly above the half-way mark on the y-axis and finishes about 2 thirds of the way along the x-axis.The curve passes through the point G, about halfway along the curve.The second curve begins slightly above the first on the y-axis, and finishes just past the end of the first on the x-axis.The curve passes through point J about 1 third of the way along the curve, and point H about 3 fourths of the way along the curve.Graph C: The x-axis is labelled, diesel-engine automobiles, and the y-axis is labelled hybrid-engine automobiles.A convex curve begins near the top of the y-axis and finishes near the end of the x-axis.It passes through point K about half-way along the curve.Point L is plotted between the curve and the axes.
-Refer to Figure 2.6.Assume that in 2019, after extensive research and development Toyota builds a new factory that can produce both types of vehicles that meet emission standards.This is best represented by the
A) movement from E to F in Graph A.
B) movement from H to J in Graph B.
C) movement from L to K in Graph C.
D) movement from J to G in Graph B.
Correct Answer:

Verified
Correct Answer:
Verified
Q25: Without an increase in the supplies of
Q52: Figure 2.2 <img src="https://d2lvgg3v3hfg70.cloudfront.net/TB3061/.jpg" alt="Figure 2.2
Q54: Figure 2.10 <img src="https://d2lvgg3v3hfg70.cloudfront.net/TB3061/.jpg" alt="Figure 2.10
Q79: Figure 2-1<br> <img src="https://d2lvgg3v3hfg70.cloudfront.net/TB4193/.jpg" alt="Figure 2-1
Q105: A decrease in the unemployment rate may
Q122: Table 2-1<br>Production choices for Tomaso's Trattoria<br> <img
Q133: Households<br>A) have no influence on the circular
Q149: Adam Smith's invisible hand refers to<br>A)the government's
Q201: Published in 1776,_ was written by Adam
Q205: Adam Smith's _ refers to the process