Multiple Choice
Figure 2.5 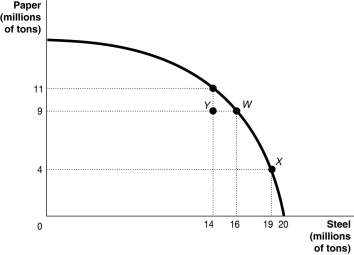 Alt text for Figure 2.5: In figure 2.5, a graph compares paper and steel production.
Long description for Figure 2.5: The x-axis is labelled, steel in millions of tons and the quantities 14, 16, 19, and 20 are marked.The y-axis is labelled, paper in millions of tons, and the quantities 4, 9, and 11 are marked.Points Y(14, 9) , W(16, 9) , (19, 4) , and an unnamed point (14, 11) are plotted on the graph, and joined to the respective axes using dotted lines.A concave curve is drawn from the y-axis to the x-axis, passing through the unnamed point (14, 11) , and points W(16, 9) , and X(19, 4) .Point Y is between the curve and the axes.
-Refer to Figure 2.5. If this economy is currently producing at point X, what is the opportunity cost of moving to point W?
A) 3 million tons of steel
B) 5 tons of paper
C) 7 tons of paper
D) 19 tons of steel
Correct Answer:

Verified
Correct Answer:
Verified
Q17: Scarcity<br>A)stems from the incompatibility between limited resources
Q27: Table 2-1<br>Production choices for Tomaso's Trattoria<br> <img
Q28: A guild is<br>A)a group of independent producers
Q36: Figure 2.7 <img src="https://d2lvgg3v3hfg70.cloudfront.net/TB3061/.jpg" alt="Figure 2.7
Q38: Crystal Schick is a highly talented photographer.She
Q40: Table 2.13 <img src="https://d2lvgg3v3hfg70.cloudfront.net/TB3061/.jpg" alt="Table 2.13
Q42: Table 2.14 <img src="https://d2lvgg3v3hfg70.cloudfront.net/TB3061/.jpg" alt="Table 2.14
Q108: _ a nation's production possibilities frontier represents
Q178: All of the following are examples of
Q385: Figure 2-18 <img src="https://d2lvgg3v3hfg70.cloudfront.net/TB7397/.jpg" alt="Figure 2-18