Multiple Choice
Figure 3.7 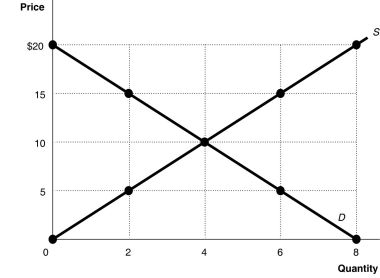 Alt text for Figure 3.7: In figure 3.7, a graph plotting intersecting supply and demand curves illustrates surplus and shortage in a market, along with an equilibrium.
Long description for Figure 3.7: The x-axis is labelled, Quantity, and is marked from 0 to 8 in increments of 2.The y-axis is labelled, Price, and is marked from 0 to 20 dollars in increments of 5.Curve D is a straight line which slopes down from the top left corner to the bottom right corner.Curve S is a straight line which begins in the bottom left corner and slopes up to the top right corner.The equilibrium of the 2 curves is marked at (4,10) .2 points plotted on the demand curve to the left of the equilibrium are (0,20) and (2,15) .2 points plotted on the demand curve to the right of the equilibrium are (6,5) and (8,0) .2 points plotted on the supply curve to the right of the equilibrium are (6,15) and (8,20) .2 points plotted on the supply curve to the left of the equilibrium are (2,5) and (0,0) .
-Refer to Figure 3.7.At a price of $5, the quantity sold
A) is 2 units.
B) is 4 units.
C) is 6 units.
D) cannot be determined.
Correct Answer:

Verified
Correct Answer:
Verified
Q37: Which of the following will not shift
Q61: In July,market analysts predict that the price
Q90: Figure 3.6 <img src="https://d2lvgg3v3hfg70.cloudfront.net/TB3061/.jpg" alt="Figure 3.6
Q92: Tuition rises almost every year, yet universities
Q93: Figure 3.6 <img src="https://d2lvgg3v3hfg70.cloudfront.net/TB3061/.jpg" alt="Figure 3.6
Q95: What would happen in the market for
Q98: If the price of propane-fuelled gas BBQs
Q143: A decrease in the price of inputs
Q156: Last month,the Tecumseh Corporation supplied 400 units
Q216: Chips and salsa are complements.If the price