Multiple Choice
Figure 3.9 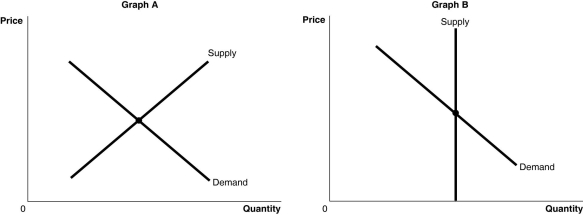 Alt text for Figure 3.9a: In figure 3.9a, a graph plotting intersecting supply and demand curves represents one of the two markets for original Michelangelo sculptures and Ray Ban sunglasses.
Long description for Figure 3.9a: The x-axis is labelled, Quantity, and the y-axis is labelled, Price.Curve Supply is a straight line which slopes up from the bottom left corner to the top right corner.Curve Demand is a straight line which slopes down from the top left corner to the bottom right corner.The 2 curves intersect at their respective midpoints.
Alt text for Figure 3.9b: In figure 3.9b, a graph plotting intersecting supply and demand curves represents one of the two markets for original Michelangelo sculptures and Ray Ban sunglasses.
Long description for Figure 3.9b: The x-axis is labelled, Quantity, and the y-axis is labelled, Price.Curve Demand is a straight line which slopes down from the top left corner to the bottom right corner.Curve Supply is a straight vertical line which begins from the midpoint of the x axis.The 2 curves intersect at their respective midpoints.
-Refer to Figure 3.9.The figure above shows the supply and demand curves for two markets: the market for original Michelangelo sculptures and the market for Ray Ban sunglasses.Which graph most likely represents which market?
A) Graph B represents the market for original Michelangelo sculptures and Graph A represents the market for Ray Ban sunglasses.
B) Graph A represents the market for original Michelangelo sculptures and Graph B represents the market for Ray Ban sunglasses.
C) Graph A represents both the market for original Michelangelo sculptures and for Ray Ban sunglasses.
D) Graph B represents both the market for original Michelangelo sculptures and for Ray Ban sunglasses.
Correct Answer:

Verified
Correct Answer:
Verified
Q201: If, for a product, the quantity supplied
Q259: Figure 3.7 <img src="https://d2lvgg3v3hfg70.cloudfront.net/TB3061/.jpg" alt="Figure 3.7
Q260: Several studies have shown promising links between
Q261: Figure 3.11 <img src="https://d2lvgg3v3hfg70.cloudfront.net/TB3061/.jpg" alt="Figure 3.11
Q262: "The price of compact LED lights fell
Q264: Auctions in recent years have resulted in
Q265: The demand for lobster is higher at
Q267: Select the phrase that correctly completes the
Q268: New technology which would allow ordinary windows
Q461: Let D = demand, S = supply,