Multiple Choice
Figure 3.11 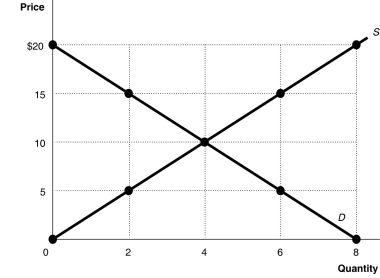 Alt text for Figure 3.11: In figure 3.11, a graph plotting intersecting supply and demand curves illustrates how supply and demand function in competitive markets.
Long description for Figure 3.11: The x-axis is labelled, Quantity, and is marked from 0 to 8 in increments of 2.The y-axis is labelled, Price, and is marked from 0 to 20 dollars in increments of 5.Curve D is a straight line which slopes down from the top left corner to the bottom right corner.Curve S is a straight line which begins in the bottom left corner and slopes up to the top right corner.The equilibrium of the 2 curves is marked at (4,10) .2 points plotted on the demand curve to the left of the equilibrium are (0,20) and (2,15) .2 points plotted on the demand curve to the right of the equilibrium are (6,5) and (8,0) .2 points plotted on the supply curve to the right of the equilibrium are (6,15) and (8,20) .2 points plotted on the supply curve to the left of the equilibrium are (2,5) and (0,0) .
-Refer to Figure 3.11.In a free market such as that depicted above, a shortage is eliminated by
A) a price increase, increasing the supply and decreasing the demand.
B) a price decrease, decreasing the supply and increasing the demand.
C) a price decrease, decreasing the quantity supplied and increasing the quantity demanded.
D) a price increase, increasing the quantity supplied and decreasing the quantity demanded.
Correct Answer:

Verified
Correct Answer:
Verified
Q27: If the number of firms producing mouthwash
Q191: Studies have shown links between calcium consumption
Q201: If, for a product, the quantity supplied
Q259: Figure 3.7 <img src="https://d2lvgg3v3hfg70.cloudfront.net/TB3061/.jpg" alt="Figure 3.7
Q260: Several studies have shown promising links between
Q262: "The price of compact LED lights fell
Q263: Figure 3.9 <img src="https://d2lvgg3v3hfg70.cloudfront.net/TB3061/.jpg" alt="Figure 3.9
Q264: Auctions in recent years have resulted in
Q265: The demand for lobster is higher at
Q461: Let D = demand, S = supply,