Multiple Choice
Figure 3.14 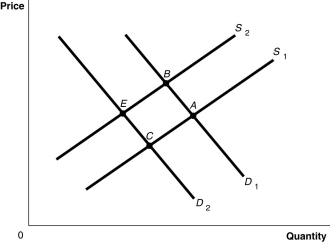 Alt text for Figure 3.14: In figure 3.14, a graph plotting intersecting demand and supply curves represents the change in equilibrium point in the apple market with the decrease in the price of a substitute fruit, orange and the increase in the wages of apple workers.
Long description for Figure 3.14: The x-axis is labelled, Quantity and the y-axis is labelled, Price.Curve D1 is a straight line which slopes down from the top left corner to the bottom right corner.Curve D2 is parallel with curve D1, but is plotted to the left.Curve S1 is a straight line which slopes up from the bottom right corner to the top left corner.Curve S2 is parallel to curve S1, but is plotted to the left.The 4 curves intersect at 4 points; A, B, on the right side of the lines, and C and D, on the left sides of the lines.
-Refer to Figure 3.14.The graph in this figure illustrates an initial competitive equilibrium in the market for apples at the intersection of D2 and S2 (point
A) a positive change in the technology used to produce apples and decrease in the price of oranges, a substitute for apples
B) an increase in the wages of apple workers and a decrease in the price of oranges, a substitute for apples
C) an increase in the number of apple producers and a decrease in the number of apple trees as a result of disease
D) a decrease in the wages of apple workers and an increase in the price of oranges, a substitute for apples
E) Which of the following changes would cause the equilibrium to change to point A?
Correct Answer:

Verified
Correct Answer:
Verified
Q9: Table 3-3<br> <img src="https://d2lvgg3v3hfg70.cloudfront.net/TB4190/.jpg" alt="Table 3-3
Q9: The income effect of a price change
Q30: A _ demand curve for shampoo would
Q35: Figure 3.3 <img src="https://d2lvgg3v3hfg70.cloudfront.net/TB3061/.jpg" alt="Figure 3.3
Q37: Table 3.1 <img src="https://d2lvgg3v3hfg70.cloudfront.net/TB3061/.jpg" alt="Table 3.1
Q38: In response to a shortage, the market
Q39: In each of the following situations, list
Q41: Suppose that a recent study finds that
Q45: Assume that both the demand curve and
Q213: The demand by all the consumers of