Multiple Choice
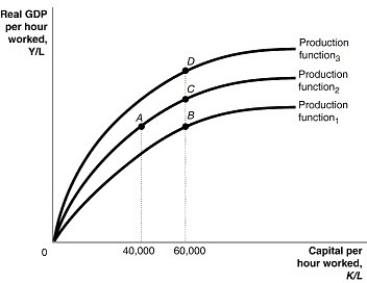
Figure 7.1  Alt text for Figure 7.1: In figure 7.1, a graph comparing capital per hour worked and real GDP per hour worked.
Long description for Figure 7.1: The x-axis is labelled, capital per hour worked, K/L, with values 40,000 and 60,000 marked.The y-axis is labelled, real GDP per hour worked, Y/L, with 0 at the vertex.3 concave curves, each originating from the vertex are shown.4 points A, B, C, and D are plotted such that point A has 40,000 as the x coordinate, and points B, C, and D have 60,000 as the x coordinate.The 3 curves pass through these points.The curve labelled, Production function 1, passes through point B.The curve labelled, Production function 2, passes through points A and C.The curve labelled, Production function 3, passes through point D.
-Refer to Figure 7.1.Suppose the per-worker production function in the figure above represents the production function for the Canadian economy.If Canada decided to double its support of university research, this would cause a movement from
A) A to B.
B) B to C.
C) B to A.
D) D to C.
E) C to A.
Correct Answer:

Verified
Correct Answer:
Verified
Q3: Technological improvements are more likely to occur
Q5: Some economists argue that the productivity slowdown
Q7: Figure 7.4 <img src="https://d2lvgg3v3hfg70.cloudfront.net/TB3061/.jpg" alt="Figure 7.4
Q9: GDP in a country grew from $10
Q10: The rate of growth of productivity in
Q11: Creative destruction means that<br>A)firms develop new products
Q12: What is the difference between foreign direct
Q13: GDP in a country grew from $10
Q52: The question of whether economic growth is
Q217: Explain the meaning of the word "convergence"