Multiple Choice
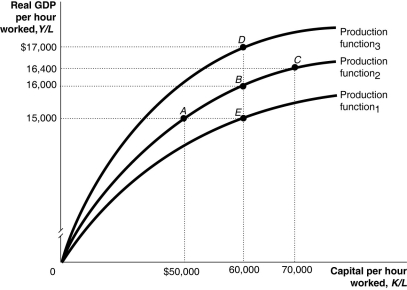
Figure 7.4  Alt text for Figure 7.4: In figure 7.4, a graph representing per-worker production functions.
Long description for Figure 7.4: The x-axis is labelled, capital per hour worked, K/L.The y-axis is labelled, real GDP per hour worked, Y/L.3 concave curves originating from 0 at the vertex are shown.5 points A ($50000, $15000) , B ($60000, $16000) , C ($70000, $16400) , D ($60000, $17000) , and E ($60000, $15000) are plotted.The curve labelled, Production function 1, passes through point E.The curve labelled, Production function 2, passes through points A, B, and C.The curve labelled, Production function 3, passes through point D.These 5 points are connected to their respective coordinates on the x-axis and y-axis with dotted lines.
-Refer to Figure 7.4.Using the per-worker production function in the figure above, the largest changes in an economy's standard of living would be achieved by a movement from
A) A to B to C.
B) E to B to D.
C) C to B to A.
D) D to B to E.
E) D to A.
Correct Answer:

Verified
Correct Answer:
Verified
Q2: Over the last three decades in Canada,
Q3: Technological improvements are more likely to occur
Q5: Some economists argue that the productivity slowdown
Q8: Figure 7.1 <img src="https://d2lvgg3v3hfg70.cloudfront.net/TB3061/.jpg" alt="Figure 7.1
Q9: GDP in a country grew from $10
Q10: The rate of growth of productivity in
Q11: Creative destruction means that<br>A)firms develop new products
Q12: What is the difference between foreign direct
Q52: The question of whether economic growth is
Q217: Explain the meaning of the word "convergence"