Multiple Choice
Figure 8.1 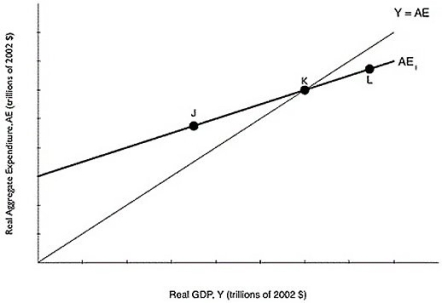 Alt text for Figure 8.1: In figure 8.1, a graph comparing real GDP and real aggregate expenditure.
Long description for Figure 8.1: The x-axis is labelled, real GDP, Y (trillions of 2002 dollars) .The y-axis is labelled, real aggregate expenditure, AE (trillions of 2002 dollars) .A line, labelled Y = AE, originates at the vertex and slopes up to the top right corner.Another line, labelled AE1, begins a little less than half way along the x-axis and slopes up to the end of the x-axis.Both these lines intersect at point K, approximately three quarters of the way along both lines.Point J is plotted a little less than half way along the line AE1, to the left of point K.Point L is plotted close to the right end of the line AE1, to the right of point K.
-Refer to Figure 8.1.If the economy is at a level of aggregate expenditure given by point K,
A) the economy is in equilibrium.
B) production is greater than spending.
C) production is less than spending.
D) inventories will increase above their desired level.
E) firms will have an incentive to increase production.
Correct Answer:

Verified
Correct Answer:
Verified
Q36: Figure 8.2 <img src="https://d2lvgg3v3hfg70.cloudfront.net/TB3061/.jpg" alt="Figure 8.2
Q37: If planned aggregate expenditure is less than
Q38: An increase in transfer payments will<br>A)increase consumption
Q40: Given Table 8.5 below, fill in the
Q42: In a small economy in 2016, aggregate
Q45: If aggregate expenditure is more than GDP,then
Q45: Consumption spending is $5 million, planned investment
Q46: The five most important variables that determine
Q192: Consumer spending _ and investment spending _.<br>A)is
Q228: Why do economists care about aggregate expenditures?