Multiple Choice
Figure 8.2 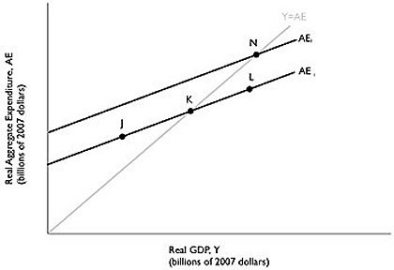 Alt text for Figure 8.2: In figure 8.2, a graph comparing real GDP and real aggregate expenditure.
Long description for Figure 8.2: Line AE1, begins a little less than half way along the x-axis and slopes up toward the end of the x-axis.Line AE2, begins at a point half way on the x-axis and slopes up to the top right corner.Line AE2 is to the left of AE1, and is on a similar path as the line AE1.Line Y = AE, originates at the vertex and slopes upward toward the top right corner.Line Y = AE meets line AE1 at point K, half way along both lines, and meets line AE2 at point N, plotted close to the right end of the line AE2.Point J is plotted a little less than half way along the line AE1, to the left of point K.Another point L is marked close to the right end of line AE1, to the right of point K.
-Refer to Figure 8.2.Suppose that the level of GDP associated with point N is potential GDP.If the Canadian economy is currently at point K,
A) firms are operating above capacity.
B) the economy is at full employment.
C) the economy is in recession.
D) the level of unemployment is equal to the natural rate.
E) firms will experience rising inventories.
Correct Answer:

Verified
Correct Answer:
Verified
Q31: Household wealth is defined as the value
Q32: A stock market boom which causes stock
Q33: The equations for C, I, G, and
Q34: The marginal propensity to consume is defined
Q35: An increase in the price level in
Q37: If planned aggregate expenditure is less than
Q38: An increase in transfer payments will<br>A)increase consumption
Q40: Given Table 8.5 below, fill in the
Q41: Figure 8.1 <img src="https://d2lvgg3v3hfg70.cloudfront.net/TB3061/.jpg" alt="Figure 8.1
Q45: If aggregate expenditure is more than GDP,then