Multiple Choice
Figure 8.2 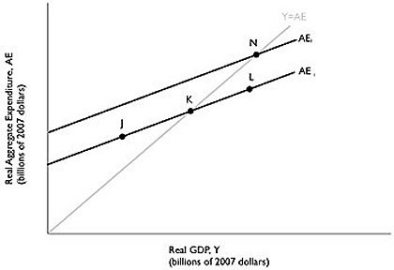 Alt text for Figure 8.2: In figure 8.2, a graph comparing real GDP and real aggregate expenditure.
Long description for Figure 8.2: Line AE1, begins a little less than half way along the x-axis and slopes up toward the end of the x-axis.Line AE2, begins at a point half way on the x-axis and slopes up to the top right corner.Line AE2 is to the left of AE1, and is on a similar path as the line AE1.Line Y = AE, originates at the vertex and slopes upward toward the top right corner.Line Y = AE meets line AE1 at point K, half way along both lines, and meets line AE2 at point N, plotted close to the right end of the line AE2.Point J is plotted a little less than half way along the line AE1, to the left of point K.Another point L is marked close to the right end of line AE1, to the right of point K.
-Refer to Figure 8.2.If the Canadian economy is currently at point K, which of the following could cause it to move to point N?
A) The price level in Canada rises relative to the price level in other countries.
B) Parliament passes investment tax incentives.
C) The interest rate rises.
D) Household wealth declines.
E) The Canadian economy grows more quickly than in other countries.
Correct Answer:

Verified
Correct Answer:
Verified
Q2: Examples of assets that are included in
Q3: If disposable income increases by $100 million,
Q5: If planned aggregate expenditure is above potential
Q8: Figure 8.3 <img src="https://d2lvgg3v3hfg70.cloudfront.net/TB3061/.jpg" alt="Figure 8.3
Q9: If the consumption function is defined as
Q10: Figure 8.4 <img src="https://d2lvgg3v3hfg70.cloudfront.net/TB3061/.jpg" alt="Figure 8.4
Q11: Table 8.11 <img src="https://d2lvgg3v3hfg70.cloudfront.net/TB3061/.jpg" alt="Table 8.11
Q153: A decrease in aggregate expenditure has what
Q259: The aggregate expenditure model focuses on the
Q269: If the multiplier is 10,the marginal propensity