Multiple Choice
Figure 8.4 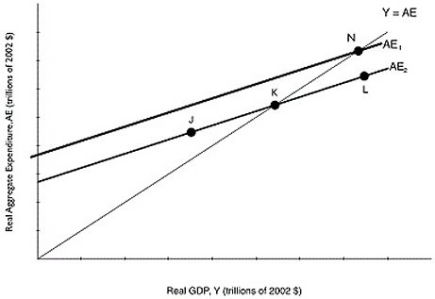 Alt text for Figure 8.4: In figure 8.4, a graph comparing real GDP and real aggregate expenditure.
Long description for Figure 8.4: The x-axis is labelled, real GDP, Y (trillions of 2002 dollars) .The y-axis is labelled, real aggregate expenditure, AE (trillions of 2002 dollars) .Line AE1, begins a little less than half way along the x-axis and slopes up to the end of the x-axis.Line AE2, begins half way along the x-axis and slopes up to the top right corner.Line AE2 is to the right of line AE1 and is on a similar path as line AE1.Line Y = AE, originates at the vertex and slopes up to the top right corner.Line Y = AE meets line AE2 at point K, half way along both lines.Line Y = AE meets line AE1 at point N, plotted close to the right end of line AE1.Point J is plotted a little less than half way along line AE2, to the left of point K.Point L is marked close to the right end of line AE2, to the right of point K.
-Refer to Figure 8.4.Suppose that the level of GDP associated with point K is potential GDP.If the Canadian economy is currently at point N,
A) firms are operating below capacity.
B) the economy is at full employment.
C) the economy is in an expansion.
D) the level of unemployment is above the natural rate.
E) the economy is in a recession.
Correct Answer:

Verified
Correct Answer:
Verified
Q5: If planned aggregate expenditure is above potential
Q7: Figure 8.2 <img src="https://d2lvgg3v3hfg70.cloudfront.net/TB3061/.jpg" alt="Figure 8.2
Q8: Figure 8.3 <img src="https://d2lvgg3v3hfg70.cloudfront.net/TB3061/.jpg" alt="Figure 8.3
Q9: If the consumption function is defined as
Q11: Table 8.11 <img src="https://d2lvgg3v3hfg70.cloudfront.net/TB3061/.jpg" alt="Table 8.11
Q13: If national income increases by $20 million
Q14: Figure 8.5 <img src="https://d2lvgg3v3hfg70.cloudfront.net/TB3061/.jpg" alt="Figure 8.5
Q15: Given the equations for C, I, G,
Q259: The aggregate expenditure model focuses on the
Q269: If the multiplier is 10,the marginal propensity