Multiple Choice
Figure 8.3 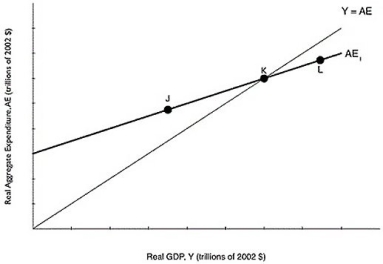 Alt text for Figure 8.3: In figure 8.3, a graph comparing real GDP and real aggregate expenditure.
Long description for Figure 8.3: The x-axis is labelled, real GDP, Y (trillions of 2002 dollars) .The y-axis is labelled, real aggregate expenditure, AE (trillions of 2002 dollars) .Line Y = AE, originates at the vertex and slopes up to the top right corner.Line AE1, begins a little less than half way along the x-axis and slopes up to the end of the x-axis.Both these lines intersect at point K, approximately 3 quarters of the way along both lines.Point J is plotted a little less than half way along line AE1, to the left of point K.Point L is marked close to the right end of the line AE1, to the right of point K.
-Refer to Figure 8.3.According to the figure above, at what point is aggregate expenditure less than GDP?
A) J
B) K
C) L
D) none of the above
Correct Answer:

Verified
Correct Answer:
Verified
Q21: Which of the following will reduce consumer
Q23: Assume proponents of public funding for a
Q24: Goods that have been produced but not
Q25: Figure 8.4 <img src="https://d2lvgg3v3hfg70.cloudfront.net/TB3061/.jpg" alt="Figure 8.4
Q27: If the consumption function is defined as
Q29: The Conference Board of Canada's Consumer Confidence
Q30: Autonomous expenditure is a type of expenditure
Q31: Household wealth is defined as the value
Q231: If consumption is defined as C =
Q302: If the multiplier is 5,the marginal propensity