Multiple Choice
Figure 8.4 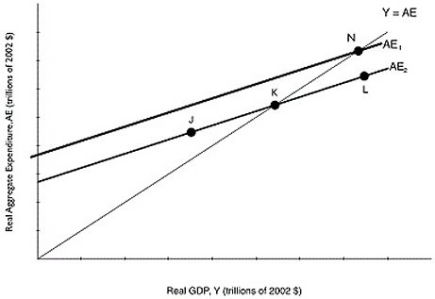 Alt text for Figure 8.4: In figure 8.4, a graph comparing real GDP and real aggregate expenditure.
Long description for Figure 8.4: The x-axis is labelled, real GDP, Y (trillions of 2002 dollars) .The y-axis is labelled, real aggregate expenditure, AE (trillions of 2002 dollars) .Line AE1, begins a little less than half way along the x-axis and slopes up to the end of the x-axis.Line AE2, begins half way along the x-axis and slopes up to the top right corner.Line AE2 is to the right of line AE1 and is on a similar path as line AE1.Line Y = AE, originates at the vertex and slopes up to the top right corner.Line Y = AE meets line AE2 at point K, half way along both lines.Line Y = AE meets line AE1 at point N, plotted close to the right end of line AE1.Point J is plotted a little less than half way along line AE2, to the left of point K.Point L is marked close to the right end of line AE2, to the right of point K.
-Refer to Figure 8.4.If the Canadian economy is currently at point N, which of the following could cause it to move to point K?
A) Households expect future income to rise.
B) Household wealth falls.
C) The firm's cash flow rises as profits rise.
D) Government expenditures increase.
E) A rise in interest rates.
Correct Answer:

Verified
Correct Answer:
Verified
Q21: Which of the following will reduce consumer
Q23: Assume proponents of public funding for a
Q24: Goods that have been produced but not
Q26: Figure 8.3 <img src="https://d2lvgg3v3hfg70.cloudfront.net/TB3061/.jpg" alt="Figure 8.3
Q27: If the consumption function is defined as
Q29: The Conference Board of Canada's Consumer Confidence
Q30: Autonomous expenditure is a type of expenditure
Q158: When we graph consumption as a function
Q231: If consumption is defined as C =
Q302: If the multiplier is 5,the marginal propensity