Multiple Choice
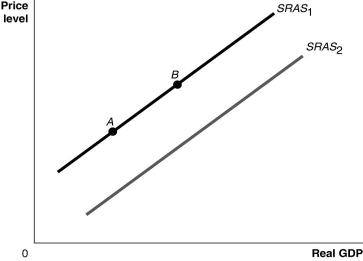
Figure 9.3  Alt text for Figure 9.3: In figure 9.3, a graph comparing real GDP and price level.
Long description for Figure 9.3: The x-axis is labelled, real GDP, with 0 at the vertex, and the y-axis is labelled, price level.2 lines are shown; SRAS1 and SRAS2.Line SRAS1 begins a little above the vertex and slopes up to the top right corner.Line SRAS2 follows the same slope as line SRAS1, but is plotted to the right.Points A and B are plotted on line SRAS1.Point A is near the left end of the line and point B is near the center of the line.
-Refer to Figure 9.3.Ceteris paribus, an increase in productivity would be represented by a movement from
A) SRAS1 to SRAS2.
B) SRAS2 to SRAS1.
C) point A to point B.
D) point B to point A.
Correct Answer:

Verified
Correct Answer:
Verified
Q123: Stagflation occurs when aggregate supply and aggregate
Q181: Explain how the economy moves back to
Q237: Explain how each of the following events
Q239: The winter of 2015 saw ridiculous levels
Q240: Long-run macroeconomic equilibrium occurs when<br>A)aggregate demand equals
Q241: When the price level in Canada rises
Q242: Suppose the economy is at a short-run
Q243: Stagflation occurs when inflation _ and GDP
Q244: Assume interest rates in the economy have
Q245: The long-run adjustment to a negative supply