Multiple Choice
Figure 11.4 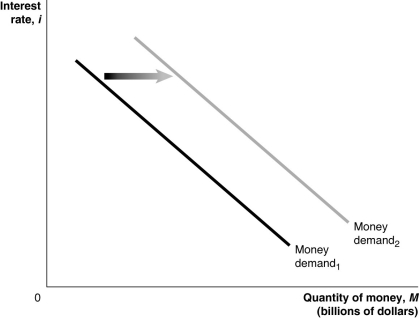 Alt text for Figure 11.4: In figure 11.4, a graph shows shift in money demand curve.
Long description for 11.4: The x-axis is labelled, quantity of money, M (billions of dollars) .The y-axis is labelled, interest rate, i.2 lines are shown; Money demand 1 and Money demand 2.Line Money, demand 1, begins in the top left corner and slopes down to the end of the x-axis.Line Money, demand 2, follows the same slope as line Money, demand 1, but is plotted to the right.The area between the lines Money, demand 1, and Money, demand 2, is indicated by a right pointing arrow.
-Refer to Figure 11.4.In the figure above, the money demand curve would move from Money demand1 to Money demand2 if
A) real GDP decreased.
B) the price level increased.
C) the interest rate increased.
D) the Bank of Canada sold government securities.
E) households expected lower incomes in the future.
Correct Answer:

Verified
Correct Answer:
Verified
Q109: The Bank of Canada can simultaneously reduce
Q110: A monetary growth rule means that<br>A)the Bank
Q111: In the Taylor rule, does the target
Q112: Use the money demand and money supply
Q113: Figure 11.8 <img src="https://d2lvgg3v3hfg70.cloudfront.net/TB3061/.jpg" alt="Figure 11.8
Q115: If the Bank of Canada targets the
Q116: Over the past decade, many economists have
Q117: Table 11.8 <img src="https://d2lvgg3v3hfg70.cloudfront.net/TB3061/.jpg" alt="Table 11.8
Q118: An increase in real GDP can shift<br>A)money
Q119: Which of the following will lead to