Multiple Choice
Figure 11.8 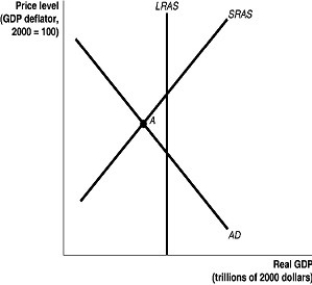 Alt text for Figure 11.8: In figure 11.8, a graph comparing real GDP and price level.
Long description for Figure 11.8: The x-axis is labelled, real GDP (trillions of 2000 dollars) , and the y-axis is labelled, price level (GDP deflator, 2000 = 100) .3 lines are shown; AD, LRAS, SRAS.Line AD begins in the top left corner and slopes down to the bottom center.Line SRAS begins in the bottom left corner and slopes up to the top right corner.Line LRAS is perpendicular to the x-axis, and intersects the lines AD and SRAS.The point of intersection of the lines AD and SRAS is marked as A.
-Refer to Figure 11.8.In the figure above, if the economy is at point A, the appropriate monetary policy by the Bank of Canada would be to
A) lower interest rates.
B) raise interest rates.
C) lower income taxes.
D) raise income taxes.
E) increase spending.
Correct Answer:

Verified
Correct Answer:
Verified
Q108: Monetary policy could be procyclical if the
Q109: The Bank of Canada can simultaneously reduce
Q110: A monetary growth rule means that<br>A)the Bank
Q111: In the Taylor rule, does the target
Q112: Use the money demand and money supply
Q114: Figure 11.4 <img src="https://d2lvgg3v3hfg70.cloudfront.net/TB3061/.jpg" alt="Figure 11.4
Q115: If the Bank of Canada targets the
Q116: Over the past decade, many economists have
Q117: Table 11.8 <img src="https://d2lvgg3v3hfg70.cloudfront.net/TB3061/.jpg" alt="Table 11.8
Q118: An increase in real GDP can shift<br>A)money