Multiple Choice
Figure 11.14 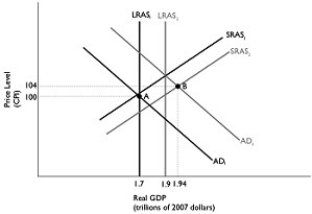 Alt text for Figure 11.14: In figure 11.14, a dynamic AD-AS model.
Long description for Figure 11.14: The x-axis is labelled, real GDP (trillions of 2007 dollars) .The y-axis is labelled, price level (CPI) .6 lines are shown; SRAS1, SRAS2, AD1, AD2, LRAS1, and LRAS2.Line SRAS1 begins near the bottom left corner and slopes up to the top right corner.Line SRAS2 follows the same slope as line SRAS1, but is plotted to the right.Line AD1 begins at the top left corner and slopes down to the end of the x-axis.Line AD2 follows the same slope as line AD1, but is plotted to the right.Line LRAS1 is perpendicular to the x-axis and begins from x-axis value 1.7.Line LRAS2 is perpendicular to the x-axis and begins from x-axis value 1.9.Line LRAS1 intersects lines AD1 and SRAS1 at point A (1.7, 100) .Lines AD2 and SRAS2 intersect at point B (1.94, 104) .Points A and B are connected to their respective coordinates on the x-axis and y-axis with dotted lines.Line LRAS1 intersects line SRAS2 below point A.Line LRAS2 intersects lines SRAS1 and AD2 just above point B.
-Refer to Figure 11.14.In the dynamic AD-AS model, if the economy is at point A in year 1 and is expected to go to point B in year 2, the Bank of Canada would most likely
A) increase interest rates.
B) decrease interest rates.
C) not change interest rates.
D) increase the inflation rate.
E) adjust its inflation target upward.
Correct Answer:

Verified
Correct Answer:
Verified
Q1: Using the Taylor rule, if the current
Q2: Assume you purchase an asset that cost
Q3: What actions should the Bank of Canada
Q4: The Bank of Canada can use contractionary
Q5: The Taylor Principle states a central bank
Q7: Figure 11.18 <img src="https://d2lvgg3v3hfg70.cloudfront.net/TB3061/.jpg" alt="Figure 11.18
Q8: Which of the following explains why mortgages
Q9: If the Bank of Canada targets the
Q10: Most economists believe that the best monetary
Q11: Expansionary monetary policy to prevent real GDP