Multiple Choice
Figure 11.18 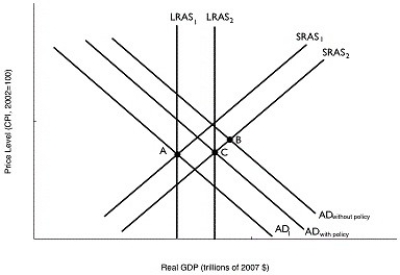 Alt text for Figure 11.18: In figure 11.18, a graph comparing real GDP and price level.
Long description for Figure 11.18: The x-axis is labelled, real GDP (trillions of 2007 dollars) .The y-axis is labelled, price level (CPI, 2002 = 100) .7 lines are shown; SRAS1, SRAS2, AD1, AD without policy, AD with policy, LRAS1, and LRAS2.Line SRAS1 begins near the bottom left corner and slopes up to the top right corner.Line SRAS2 follows the same slope as line SRAS1, but is plotted to the right.Line AD1 begins at the top left corner and slopes down toward the end of the x-axis.Lines AD without policy, and AD with policy, follow the same slope as line AD1, but are plotted to the right.Lines LRAS1 and LRAS2 are perpendicular to the x-axis such that line LRAS2 is to the right of line LRAS1.Line LRAS1 intersects lines AD1 and SRAS1 at point A.Lines AD without policy, and SRAS2 intersect at point B.Line LRAS2 intersects the lines AD with policy, and SRAS2 at point C.
-Refer to Figure 11.18.In the figure above, suppose the economy in Year 1 is at point A and is expected in Year 2 to be at point B.Which of the following policies could the Bank of Canada use to move the economy to point C?
A) decrease income taxes
B) decrease the desired reserve ratio
C) buy government securities
D) sell government securities
E) extend additional loans to commercial banks
Correct Answer:

Verified
Correct Answer:
Verified
Q2: Assume you purchase an asset that cost
Q3: What actions should the Bank of Canada
Q4: The Bank of Canada can use contractionary
Q5: The Taylor Principle states a central bank
Q6: Figure 11.14 <img src="https://d2lvgg3v3hfg70.cloudfront.net/TB3061/.jpg" alt="Figure 11.14
Q8: Which of the following explains why mortgages
Q9: If the Bank of Canada targets the
Q10: Most economists believe that the best monetary
Q11: Expansionary monetary policy to prevent real GDP
Q12: Suppose the equilibrium real overnight interest rate