Multiple Choice
Figure 12.4 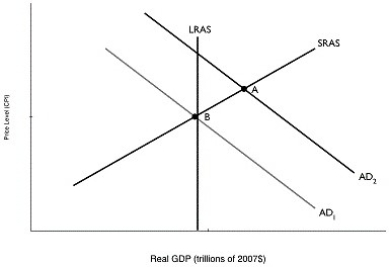 Alt text for Figure 12.4: In figure 12.4, a graph comparing real GDP and price level.
Long description for Figure 12.4: The x-axis is labelled, real GDP (trillions of 2007 dollars) and the y-axis is labelled, price level (CPI) .4 lines are shown; AD1, AD2, LRAS, and SRAS.Line AD1 begins at the top left corner and slopes down to the end of the x-axis.Line AD2 follows the same slope as line A1, but is plotted to the right.Line SRAS begins in the bottom left corner and slopes up to the top right corner.Line LRAS is perpendicular to the x-axis, and intersects lines AD1 and SRAS at point B.Lines AD2 and SRAS intersect at point A.
-Refer to Figure 12.4.In the graph above, suppose the economy is initially at point A.The movement of the economy to point B as shown in the graph illustrates the effect of which of the following policy actions by the federal government?
A) an increase in transfer payments
B) an increase in interest rates
C) an increase in the marginal income tax rate
D) an open market purchase of Canadian government bonds
E) an increase in government spending
Correct Answer:

Verified
Correct Answer:
Verified
Q2: In a closed economy with fixed or
Q9: From an initial long-run equilibrium, if aggregate
Q10: Figure 12.6 <img src="https://d2lvgg3v3hfg70.cloudfront.net/TB3061/.jpg" alt="Figure 12.6
Q11: The automatic budget surpluses and budget deficits
Q12: Tax cuts on business income increase aggregate
Q13: A recession tends to cause the federal
Q15: Which of the following would be classified
Q17: Figure 12.11 <img src="https://d2lvgg3v3hfg70.cloudfront.net/TB3061/.jpg" alt="Figure 12.11
Q18: A tax rebate by the government would<br>A)increase
Q257: Decreasing government spending _ the price level