Multiple Choice
Figure 12.11 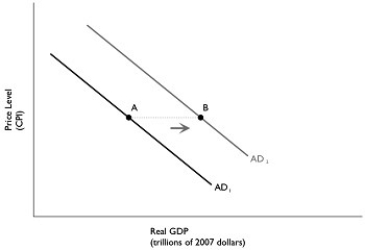 Alt text for Figure 12.11: In figure 12.11, a graph depicting the total change in aggregate demand.
Long description for Figure 12.11: The x-axis is labelled, real GDP (trillions of 2007 dollars) , and the y-axis is labelled, price level (CPI) .2 lines are shown; AD1 and AD2.Line AD1 begins at the top left corner and slopes down to the bottom center.Line AD2 follows the same slope as line AD1, but is plotted to the right.Point A is plotted half way along line AD1.Point B is plotted approximately 3 quarters of the way along line AD2.Points A and B are connected with a dotted line, and the area between them is indicated by a right pointing arrow.
-Refer to Figure 12.11.In the graph above, the shift from AD1 to AD2 represents the total change in aggregate demand.If government purchases increased by $50 billion, then the distance from point A to point B ________ $50 billion.
A) would be equal to
B) would be greater than
C) would be less than
D) may be greater than or less than
Correct Answer:

Verified
Correct Answer:
Verified
Q2: In a closed economy with fixed or
Q12: Tax cuts on business income increase aggregate
Q13: A recession tends to cause the federal
Q14: Figure 12.4 <img src="https://d2lvgg3v3hfg70.cloudfront.net/TB3061/.jpg" alt="Figure 12.4
Q15: Which of the following would be classified
Q18: A tax rebate by the government would<br>A)increase
Q20: Government deficits tend to increase during<br>A)recessions and
Q21: Forecasts of health care spending in Canada
Q22: Which of the following is an objective
Q257: Decreasing government spending _ the price level