Multiple Choice
Figure 12.6 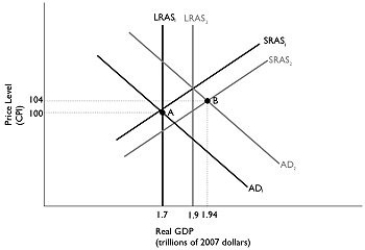 Alt text for Figure 12.6: In figure 12.6, a dynamic model of AD-AS.
Long description for Figure 12.6: The x-axis is labelled, real GDP (trillions of 2007 dollars) .The y-axis is labelled, price level (CPI) .6 lines are shown; SRAS1, SRAS2, AD1, AD2, LRAS1, and LRAS2.Line SRAS1 begins in the bottom left corner and slopes up to the top right corner.Line SRAS2 follows the same slope as line SRAS1, but is plotted to the right.Line AD1 begins in the top left corner and slopes down to the bottom center.Line AD2 follows the same slope as line AD1, but is plotted to the right.Line LRAS1 is perpendicular to the x-axis, and begins from the x-axis value 1.7.Line LRAS2 is perpendicular to the x-axis, and begins from the x-axis value 1.9.Line LRAS1 intersects lines AD1 and SRAS1 at point A (1.7, 100) .Lines AD2 and SRAS2 intersect at point B (1.94, 104) .Points A and B are connected to their respective coordinates on the x and y-axes with dotted lines.Line LRAS1 intersects the line SRAS2 below point A.Line LRAS2 intersects the lines SRAS1 and AD2 just above point B.
-Refer to Figure 12.6.In the dynamic model of AD-AS in the figure above, if the economy is at point A in year 1 and is expected to go to point B in year 2, the federal government would most likely pursue
A) expansionary fiscal policy.
B) contractionary fiscal policy.
C) expansionary monetary policy.
D) contractionary monetary policy.
E) expansionary automatic stabilizers.
Correct Answer:

Verified
Correct Answer:
Verified
Q1: In the last 5 years, government spending
Q2: Figure 12.1 <img src="https://d2lvgg3v3hfg70.cloudfront.net/TB3061/.jpg" alt="Figure 12.1
Q3: Suppose real GDP is $1.7 trillion and
Q6: Figure 12.7 <img src="https://d2lvgg3v3hfg70.cloudfront.net/TB3061/.jpg" alt="Figure 12.7
Q7: The increase in government spending on Employment
Q9: From an initial long-run equilibrium, if aggregate
Q10: Figure 12.6 <img src="https://d2lvgg3v3hfg70.cloudfront.net/TB3061/.jpg" alt="Figure 12.6
Q11: The automatic budget surpluses and budget deficits
Q39: The government purchases multiplier will be larger
Q158: Suppose Political Party A proposes a tax